Kubernetes API server 默认启用了 profiling
| –profiling 默认值:true | |
通过 Web 接口 host:port/debug/pprof/ 启用性能分析。 | |
检查 API server 的启动参数中是否包含 –profiling 选项,默认是开启状态的,如果该选项是否设置为 false(默认是启用的),则需要设为true来开启。
启用 profiling 后,你可以访问以下 profiling endpoints:
• Heap Profile:/debug/pprof/heap
• Goroutine Profile:/debug/pprof/goroutine
• Thread Create Profile:/debug/pprof/threadcreate
• Block Profile:/debug/pprof/block
• CPU Profile:/debug/pprof/profile?seconds=30 (默认 30 秒)
假设 API server 的地址为 https://<api-server-address>, 你可以通过以下命令获取相应的 profile:
# 获取 heap profile
curl -k -H "Authorization: Bearer <your-token>" https://<api-server-address>/debug/pprof/heap > heap.out

# 获取 goroutine profile
curl -k -H "Authorization: Bearer <your-token>" https://<api-server-address>/debug/pprof/goroutine > goroutine.out

# 获取 thread create profile
curl -k -H "Authorization: Bearer <your-token>" https://<api-server-address>/debug/pprof/threadcreate > threadcreate.out

# 获取 block profile
curl -k -H "Authorization: Bearer <your-token>" https://<api-server-address>/debug/pprof/block > block.out

# 获取 CPU profile
curl -k -H "Authorization: Bearer <your-token>" https://<api-server-address>/debug/pprof/profile?seconds=30 > cpu.out
请注意,<your-token> 需要替换为有效的 Bearer Token,用于身份验证。这个 Token 可以从 Kubernetes 集群中获取,例如使用 kubectl config view –minify -o jsonpath='{.users[0].user.token}’。
cat /etc/kubernetes/manifests/kube-apiserver.yaml
apiVersion: v1
kind: Pod
metadata:
  annotations:
    kubeadm.kubernetes.io/kube-apiserver.advertise-address.endpoint: 192.168.0.55:6443
  creationTimestamp: null
  labels:
    component: kube-apiserver
    tier: control-plane
  name: kube-apiserver
  namespace: kube-system
spec:
  containers:
  - command:
    - kube-apiserver
    - --advertise-address=192.168.0.55
    - --allow-privileged=true
    - --audit-log-format=json
    - --audit-log-maxage=7
    - --audit-log-maxbackup=10
    - --audit-log-maxsize=100
    - --audit-log-path=/var/log/kubernetes/audit.log
    - --audit-policy-file=/etc/kubernetes/audit-policy.yml
    - --authorization-mode=Node,RBAC
    - --client-ca-file=/etc/kubernetes/pki/ca.crt
    - --enable-admission-plugins=NodeRestriction
    - --enable-aggregator-routing=true
    - --enable-bootstrap-token-auth=true
    - --etcd-cafile=/etc/kubernetes/pki/etcd/ca.crt
    - --etcd-certfile=/etc/kubernetes/pki/apiserver-etcd-client.crt
    - --etcd-keyfile=/etc/kubernetes/pki/apiserver-etcd-client.key
    - --etcd-servers=https://127.0.0.1:2379
    - --kubelet-client-certificate=/etc/kubernetes/pki/apiserver-kubelet-client.crt
    - --kubelet-client-key=/etc/kubernetes/pki/apiserver-kubelet-client.key
    - --kubelet-preferred-address-types=InternalIP,ExternalIP,Hostname
    - --proxy-client-cert-file=/etc/kubernetes/pki/front-proxy-client.crt
    - --proxy-client-key-file=/etc/kubernetes/pki/front-proxy-client.key
    - --requestheader-allowed-names=front-proxy-client
    - --requestheader-client-ca-file=/etc/kubernetes/pki/front-proxy-ca.crt
    - --requestheader-extra-headers-prefix=X-Remote-Extra-
    - --requestheader-group-headers=X-Remote-Group
    - --requestheader-username-headers=X-Remote-User
    - --secure-port=6443
    - --service-account-issuer=https://kubernetes.default.svc.cluster.local
    - --service-account-key-file=/etc/kubernetes/pki/sa.pub
    - --service-account-signing-key-file=/etc/kubernetes/pki/sa.key
    - --service-cluster-ip-range=10.96.0.0/22
    - --tls-cert-file=/etc/kubernetes/pki/apiserver.crt
    - --

这里以我们的集群为例,已知apiserver ca证书文件,我们则可以通过该证书来请求访问api-server
获取 Heap Profile:
curl --cacert /etc/kubernetes/pki/ca.crt \
     --cert /etc/kubernetes/pki/apiserver-kubelet-client.crt \
     --key /etc/kubernetes/pki/apiserver-kubelet-client.key \
     https://192.168.0.55:6443/debug/pprof/heap > heap.out
获取 Goroutine Profile:
curl --cacert /etc/kubernetes/pki/ca.crt \
     --cert /etc/kubernetes/pki/apiserver-kubelet-client.crt \
     --key /etc/kubernetes/pki/apiserver-kubelet-client.key \
     https://192.168.0.55:6443/debug/pprof/goroutine > goroutine.out
获取 CPU Profile:
curl --cacert /etc/kubernetes/pki/ca.crt \
     --cert /etc/kubernetes/pki/apiserver-kubelet-client.crt \
     --key /etc/kubernetes/pki/apiserver-kubelet-client.key \
     https://192.168.0.55:6443/debug/pprof/profile?seconds=30 > cpu.out
使用 go tool pprof 分析 Profile 数据 (需要安装golang环境,go pprof 是go官方的profiling 使用非常简单):
# 分析 heap profile
go tool pprof heap.out

# 分析 goroutine profile
go tool pprof goroutine.out

# 分析 CPU profile
go tool pprof cpu.out
在 pprof 交互式命令行中,你可以使用 top、list、web 等命令来进一步分析和可视化 profile 数据:
例如web:
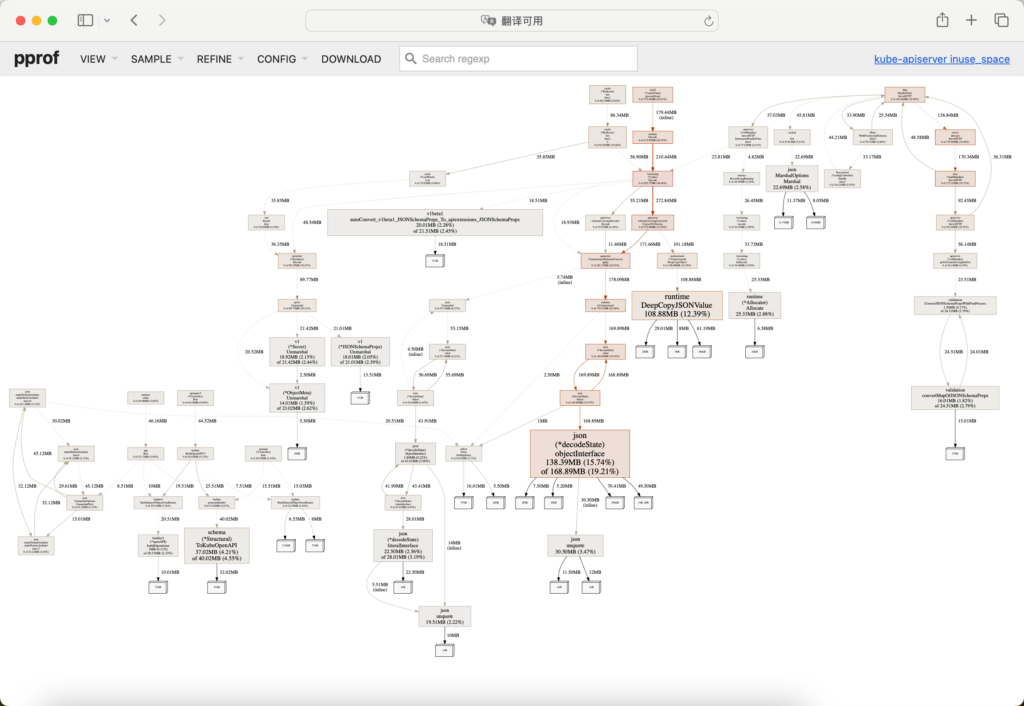
go tool pprof -http :8080 heap.outgo tool pprof -http 192.168.0.55:8080 heap.out
Serving web UI on http://192.168.0.55:8080 #访问地址
Couldn't find a suitable web browser!
Set the BROWSER environment variable to your desired browser.
Failed to execute dot. Is Graphviz installed?
exec: "dot": executable file not found in $PATH
Failed to execute dot. Is Graphviz installed?
exec: "dot": executable file not found in $PATH这里报错dot找不到apt-get install graphviz 后在执行即可。